Avoiding unplanned press shutdowns
Vibration monitoring on the press drive: predict failures of the motor – do not wait until idle.
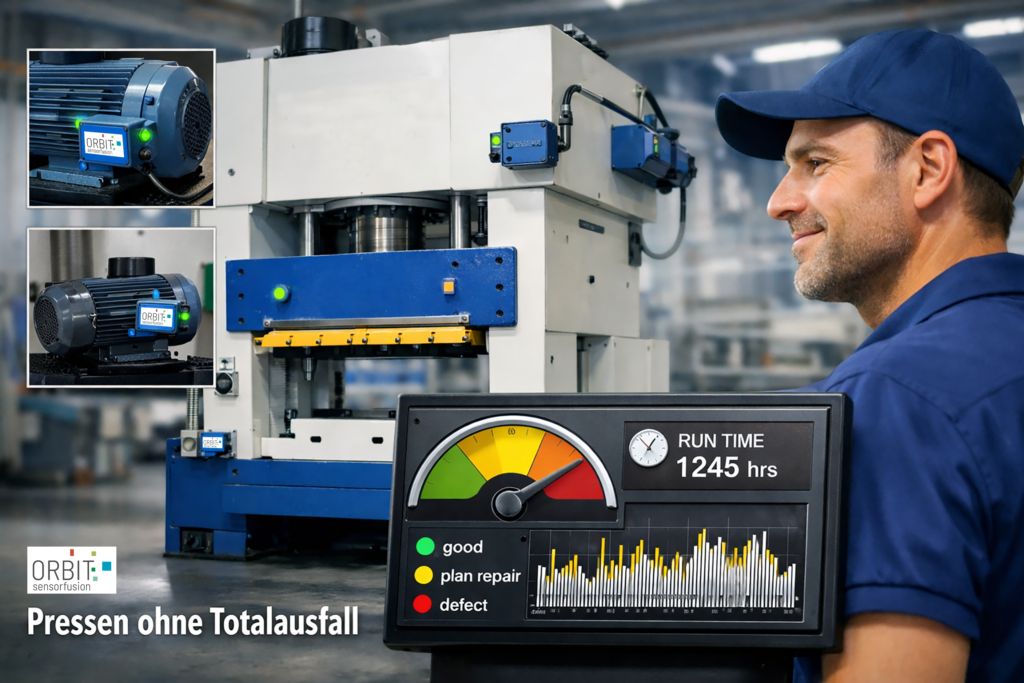
Capture multi-sensor data such as vibration & temperature on the drive, evaluate it with AI and plan maintenance.
Table of Contents
Condition monitoring on the press drive
You want to know at any time whether your press drive is running stable? That's what you're setting up for. Multi-sensor system one. With this you can Failures Timely Forecasts Plan your budget optimally.
In 10 minutes to the first findings.
Throughout Wireless sensors It is especially easily The multi-sensor system retrofitting. The gateway and data infrastructure provide data management. The AI At the beginning of the project, certain Evaluations shall be carried out. More complex evaluations are quickly integrated. The Browser cockpit Only show you the Results which you really need.
Support & customization requests for each system component.
sensor node, data infrastructure, evaluation algorithms or data retrieval. All system components Coming from one hand. They are coordinated for smooth operation. If you would like to request an individual solution or need support, you can ask us. No matter which system component.
Engine shutdowns with multi-sensor technology robustly predict.
Multi-sensors are for your AI and data evaluation as Additional senses.
Instead of just "vibration yes/no" you get a Overall picture your motor from various sensor information (vibration, temperature, ...) at the measuring point. By Detected Your AI Imminent standstill better. With this information you can Proactive exchange parts, instead of you on one Annual assessment to leave.
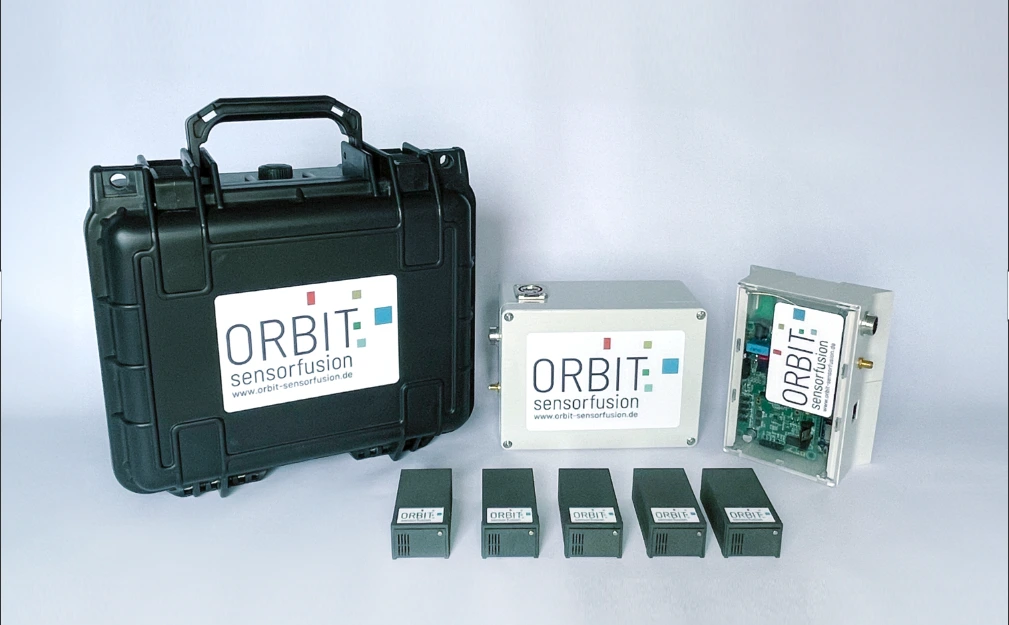
How to use the Multisensor Cockpit
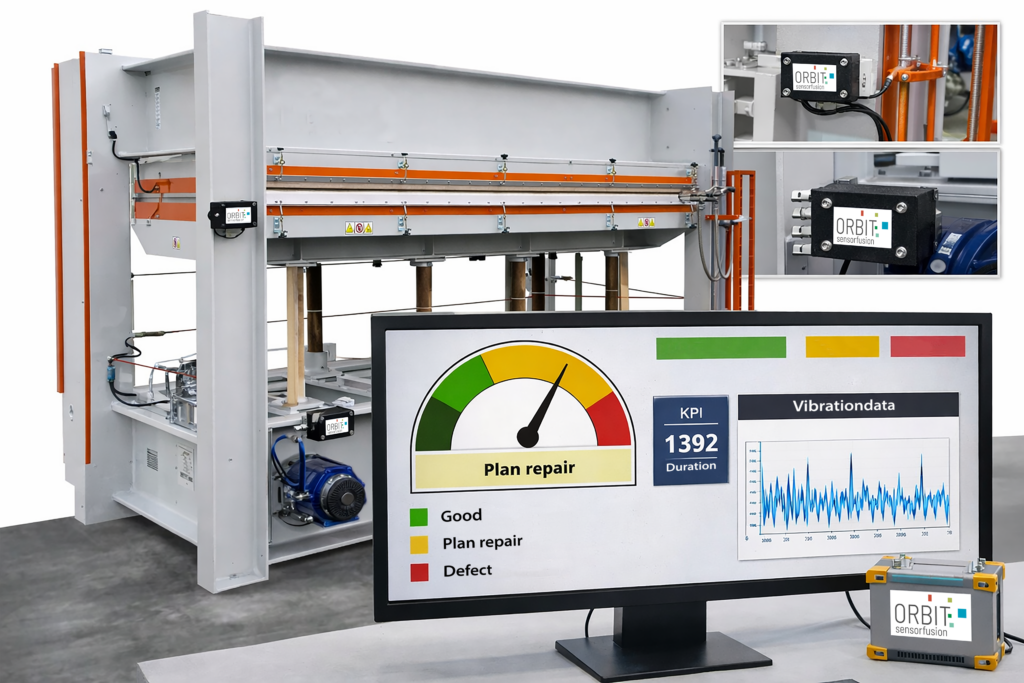
1. Install sensor nodes on the drive
You place the sensor nodes at the relevant points of your drive train, for example on the engine, gearbox, bearing or clutch. You start without complex wiring and without long downtimes.
2. Turn on gateway and collect data
You put the gateway into operation and start the data collection. You get a data stream directly from the plant and create transparency about the status during operation.
3. Track condition in the cockpit and plan measures
You see trends and abnormalities in the browser. From this, you deduce whether you will be active in the next maintenance interval and which measures you plan.
Making maintenance on the press drive plannable
If in a particle board plant you Main press Wanting to secure, hardly a path leads to one Vibration monitoring past the press drive. Because the press drive is often the critical bottleneck: As soon as the motor or drive train fails, there is no "any system", but often The whole line – with high downtime costs, high internal coordination and massive pressure on maintenance and production.
This is precisely why this use case is not about "more data", but about Make the condition visible:
- as a course instead of a snapshot,
- with clear signals for bearings, propulsion and load conditions,
- and with enough lead to maintenance interval, budget and spare parts Plannable to make.
In this section you will read which job you want to solve around the press drive, why annual assessments in everyday life lead to blurred decisions, which requirements a retrofit solution must meet – and how you can orbit sense READY in a pilot in such a way that measured values become real predictability.
Continuously assess engine condition
You are responsible for ensuring that the press drive runs reliably. Your job is, between maintenance intervals to be able to assess whether the drive is working stably – or whether a risk is building up that you have to take into your planning early on.
In practice, this means that you do not want to hear "in 5-8 months it could be critical" once a year, but you want answers to questions such as:
- What is the storage state today – and how does it develop? (Bearing diagnosis via vibration)
- Are there signs that damage is building up? (Trend/Drift instead of gut feeling)
- How does behavior change under load? (Clean load conditions)
- How much advance do I have realistically? (maintenance plannable instead of reactive)
Especially with large presses, this is crucial: An unplanned standstill can be extremely expensive, and a replacement on the main drive can take a very long time. The sooner you see the condition and trend, the sooner you can take measures to ensure that production, spare parts and service providers Without escalation fit together.
The starting position: snapshot instead of course
Many particle board plants assess the large press and its press drive once a year. That gives you a snapshot. However, your operation is constantly changing: load change, shift operation, temperature, material, start-up and shutdown phases. If you do not see the course, you plan with uncertainty.
This uncertainty produces typical effects:
- You set maintenance intervals and budgets roughly because you lack intermediate signals.
- You exchange parts prophylactically because you cannot quantify the risk cleanly.
- You respond to events instead of dragging them into your plan.
- You get into explanatory print when a standstill comes at the wrong time.
The core problem is: Between the Service intervals The condition is unknown. And that's where the stress comes from. As soon as the press drive fails unplanned, you have to find causes under time pressure, coordinate measures and justify costs – even though you had little chance of seeing the development clean beforehand.
The solution is not "yet another report" but Condition monitoring As a continuous process: vibrations, temperature and context signals show you whether something is building up – long before it pops.
A practical solution for retrofitting
You want to quickly find out if an approach to your press works. You need clear signals that you can use in everyday life. And you don’t want to start a months-long integration project.
A practical retrofit solution for Vibration monitoring on the press drive Therefore, usually meets these requirements:
1) Fast start without plant conversion
You want to retrofit sensors, test measuring points and see the first trends within a short time – without a shutdown project.
2 2 Unique diagnostic signals instead of data lettuce
You want to know if a bearing is running healthy or if a typical pattern of wear/damage is building up. Right here is Vibration analysis strong, because bearing states can often be clearly depicted in vibrations.
3) Context for load and operating states
Vibrations alone are good – but in the factory you also want to understand why A signal changes. Changing loads is everyday life. If you can also classify load/operating states cleanly, your evaluation will be more stable and your planning better.
4) Low coordination with IT and operations
You want a solution that you can operate without permanently committing internal resources – and the results must be traceable for maintenance and production.
orbit sense READY as a complete solution
The orbit sense READY You use it as a continuous system: Capture → Transmission → Visualization → (optional) model/logic.
Detection at the drive (measurement points in practice)
For the press drive, typical measuring locations are where changes in state are best shown – especially in the case of bearing and drive problems:
- Bearing points on the motor (e.g. bearing housing / near bearing block)
- Proximity of powertrain (e.g. clutch/gearbox area depending on bodywork)
- Machine structure / Foundation proximity as an additional point (if you want to know how vibrations are transferred to the structure and if "the overall behavior" changes)
What is important is less "the one perfect point", but a setup that gives you Reproducible trends delivers. Therefore, it is helpful to quickly test measurement points in the pilot and to select them so that the signal is stable and meaningful.
Assembly: fast retrofit, clean coupling
You have several options to get the vibrations clean into the sensor:
- Sticking For very fast tests
- Screw screws via mounting plate for stronger, reproducible mechanical coupling (typical: better for stable trend measurement)
Multi-sensor technology: not only vibration, but context
Orbit detects not only vibrations, but several signals per sensor node – this is exactly what is an advantage in the factory because you get operational context:
- Vibrations/vibrations For storage condition, mechanical changes, trend/drift
- Temperature as an additional indicator (e.g. thermal load, friction, changes over time)
- Magnetic field changes als indirekter Hinweis auf Lastzustände (wenn der Motor mehr/ weniger Last hat, ändert sich die Signatur)
- Drehzahl indirekt erfassen (z. B. über Magnet-Impulse → daraus lässt sich eine Drehzahl ableiten)
- Druck (wenn relevant im Umfeld/Prozess – als weiterer Kontextkanal)
Datenkette:
Die Knoten laufen akkubetrieben und übertragen drahtlos an ein Gateway. Im Browser-Cockpit siehst du Rohdaten (für Analyse) und verdichtete Signale (für den Alltag). Damit hast du eine saubere End-to-End-Kette von Messpunkt bis Visualisierung – ohne dass du erst eine Großintegration brauchst.
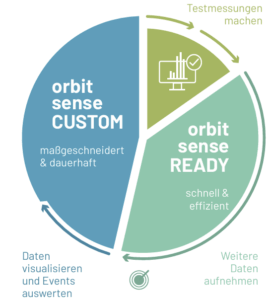
Was das Multisensorsystem im Werk bringt
Wenn du den Pressenantrieb mit Schwingungsüberwachung und Kontextsignalen überwachst, verändert sich dein Alltag spürbar. Fünf konkrete Effekte:
- Du planst Wartung früher und sauberer
Du erkennst Trends im Lagerzustand und im Antriebsverhalten. Statt „irgendwann in 5–8 Monaten“ bekommst du eine Entwicklung, die du in Wartungsintervalle übersetzen kannst. - Du koordinierst ruhiger – ohne Eskalation
Mit Vorlauf kannst du Produktion, Ersatzteile und Dienstleister so einplanen, dass Stillstände nicht „passieren“, sondern geplant sind. - Du triffst Entscheidungen faktenbasiert statt prophylaktisch
Wenn du Trenddaten hast, musst du weniger auf Verdacht tauschen. Du kannst gezielter investieren und Maßnahmen begründen. - Du reduzierst Stillstandsrisiko an der Hauptpresse
Weil die Hauptpresse ein Engpass ist, sind ungeplante Stillstände besonders teuer. Zustandsüberwachung hilft dir, Risiken früh zu sehen und Maßnahmen in planbare Intervalle zu ziehen. - Du baust ein belastbares Zielbild auf: Transparenz → Warnlogik → optional ML
- Stufe 1: stabile Messpunkte + Trendtransparenz
- Stufe 2: Warnlogik/Schwellenwerte passend zu eurer Presse und euren Betriebszuständen
- Stufe 3 (optional): Machine Learning als Planungshilfe, wenn du genug Daten über verschiedene Lastzustände gesammelt hast
Gerade die Last-Erkennung über Magnetfeldsignaturen und die indirekte Drehzahl helfen dabei, Messdaten besser zu interpretieren: Du trennst „Signal ändert sich wegen Last“ von „Signal ändert sich wegen Zustand“. Dadurch werden Warnungen belastbarer und du bekommst weniger Fehlalarme.
Du schaust ins Cockpit und siehst den Zustand des Pressenantriebs als Verlauf: stabil, driftend oder kritisch. Du erkennst früh, wenn sich ein Risiko aufbaut – und du kannst Maßnahmen in geplante Intervalle ziehen, statt von ungeplanten Stillständen überrascht zu werden.
Das entlastet Instandhaltung und Produktion:
- weniger Ad-hoc-Einsätze
- weniger Druck auf das Team
- weniger Rechtfertigung im Nachhinein
- mehr Planbarkeit bei Budget, Teilen und Ressourcen
So wird aus „Daueranspannung“ ein planbarer Prozess: Zustand erkennen, Maßnahmen ableiten, Stillstände kontrolliert durchführen.
Nächster Schritt: Kurzer Kontakt, klare Einschätzung
Du schilderst kurz eure Presse und euren Antriebsaufbau (Motor, Lagerstellen, Antriebstrang, typische Lastzustände, Wartungsintervalle). Wir geben dir eine klare Einschätzung:
- welche Messpunkte für Vibration monitoring on the press drive sinnvoll sind,
- wie viele Sensorknoten für euren Pilot passen (typisch: bis zu 3 Messpunkte an einem Antrieb),
- und wie der Pilot abläuft – von der schnellen Installation bis zur Auswertung.
Pilot-Logik, wie sie in der Praxis funktioniert:
- Aufbau: in ~10 Minuten montiert (kleben oder verschrauben)
- Erste Sichtung: innerhalb kurzer Zeit erste Signale/Trends prüfen und Messpunkte optimieren
- Für ML/Belastbarkeit: Daten über mehrere Betriebszustände/Lasten sammeln; je nach Zielbild meist ab ~2 Wochen+, wenn verschiedene Lastzustände sauber abgebildet werden sollen
FAQ - Häufige allgemeine Fragen
Wie schnell bekomme ich erste verwertbare Ergebnisse nach der Installation?
Die ersten Daten laufen meist schon nach ca. 10 Minuten ein. Mit einfachen Auswertetechniken (Trends, Basischecks) kann direkt nach der Installation gestartet werden. Für belastbare Predictive-Modelle braucht es je nach Ziel zusätzlich Historie.
Was ist ein Sensorknoten und wie viele brauche ich?
Als Sensorknoten bezeichnen wir unseren Multisensor. Jeder Multisensor besteht aus einer Leiterplatine mit 10 Einzelsensoren: Schwingung/ Vibration (Beschleunigung), Gyro, Magnetfeld, Temperatur, Luftfeuchte, Luftdruck, VOC/BVOC, eCO₂, IAQ-Index und Licht. Zusätzlich können (je nach Setup) weitere externe Sensorparameter angebunden werden.
Standardmäßig wird ein System mit 5 Sensorknoten geliefert. Für einen Pressen-Motor starten viele Kunden mit 1–2 Sensorknoten, um Vibrationsdaten am Motor/Lager zu erfassen (plus optional Temperatur). Für die ganze Presseanlage kommen oft mehrere Punkte an Lagerstellen/Getrieben/Antrieben dazu. (Das hängt stark von Mechanik, Zugänglichkeit und dem erwarteten Fehlerbild ab.)
Wie werden die Sensorknoten montiert?
Es gibt mehrere Montageoptionen – je nachdem, wie „schnell“ oder wie „industrialisiert“ es sein soll:
- ganz einfach & flexibel: doppelseitiges Klebeband or Kabelbinder
- robust/individuell: verschraubbare Montageplatten bzw. kundenspezifische Halter/Gehäuse
- je nach Messpunkt auch möglich: Magnetmontage
Wichtig ist immer eine feste, schwingungstreue Befestigung am gewünschten Messpunkt.
Wie wie oft muss ich Batterien wechseln?
Das hängt stark vom Use Case ab – vor allem von der Abtastrate:
- bei hochfrequenter Vibration (maximale Last) liegt die Laufzeit typischerweise bei 3–4 Tagen
- bei wenigen Messungen (z. B. alle 15 Minuten für 2 Minuten) kann ein Sensorknoten mehrere Monate laufen.
Wenn dauerhaft hohe Messlast gefordert ist, kann die Energieversorgung auch kabelgebunden über das Stromnetz sichergestellt werden.
Kann ich vorhandene Sensorik integrieren?
Grundsätzlich ja. Standardmäßig arbeiten wir mit unserem Sensorknoten-Ökosystem, vorhandene Sensorik kann aber je nach Signal/Interface integriert werden – typischerweise über MQTT oder REST, oder über das Gateway mit Bluetooth. Wenn es keine direkte Standardanbindung gibt, ist es ein Integrationsprojekt.
FAQ - Häufige technische Fragen
Über welche Funk-/Kabelstandards sprechen Sensor und Gateway mit welcher Reichweite?
Sensorknoten zu Gateway läuft über Bluetooth Low Energy (BLE). Gateway zu Cloud läuft typischerweise über LTE oder WLAN. Die Reichweite hängt von den Umgebungsbedingungen ab; in der Praxis liegen wir – je nach Bandbreiten-/Datenlast – typischerweise bei bis zu ca. 10 Metern um das Gateway.
Wie viele Sensorknoten kann ein Gateway gleichzeitig bedienen?
Das hängt stark vom Use Case bzw. von der Datenrate ab:
- bei hochfrequenten Vibrations-/Schwingungsdaten sind typischerweise 2–3 Sensorknoten pro Gateway realistisch
- ein System wird üblicherweise ab 5 Sensorknoten geliefert
- bei Umgebungsdaten (z. B. Temperatur/Feuchte) sind auch bis zu ca. 10 Sensorknoten möglich
Wie wird das Gateway in unsere IT integriert?
Standard ist die Anbindung per LTE/WLAN in die Cloud. Wenn Daten lokal bleiben sollen, kann das Gateway Daten auch an einen kundenseitigen MQTT-Broker oder in eine kundenseitige Datenbank übertragen. Typische Integrationen sind MQTT und REST.
Wie erfolgt die Inbetriebnahme und wie viel Aufwand ist das pro Maschine?
Typisch: Sensorknoten montieren → Messpunkte im Dashboard benennen → Daten prüfen. Für reines Monitoring geht das innerhalb von wenigen Minuten. Standard-Datenauswertung inbegriffen. Wenn ein komplexer KI-Use-Case umgesetzt wird, kommt zusätzlich Daten-/Zieldefinition und Abnahme dazu.
Wie werden Updates des Systems gemacht?
Updates erfolgen üblicherweise über Remote-Mechanismen (Gateway/Backend), damit die Systeme auf dem aktuellen Stand bleiben.
FAQ - Häufige Fragen zu den Daten
Welche Abtastraten sind möglich?
Für Vibration sind bis 800 Hz möglich (in Kürze auch bis zu 12kHz). Andere Umweltsensoren laufen typischerweise langsamer.
Welche Daten werden Wo gespeichert? Und wie lange?
Erfasst werden grundsätzlich Rohdaten. Bei der Verarbeitung (z. B. durch KI) kann entschieden werden, ob Rohdaten mit gespeichert werden oder ob nur aggregierte/verarbeitete Werte (Features/Ergebnisse) in die Datenbank weitergeschrieben und im Dashboard angezeigt werden.
Standardmäßig werden diese Daten in der Cloud auf deutschen, DSGVO-konformen Servern gespeichert. Alternativ kann das Gateway Daten auch an kundenseitiges MQTT oder eine kundenseitige Datenbank liefern.
Wenn Rohdaten auf unsere interne Datenbank geschrieben werden, kann die Speicherdauer konfiguriert werden. Typische Richtwerte liegen – je nach Datenmenge und Kundenanforderung – bei ca. 1 bis 12 Monaten.
Wer macht die Datenauswertung?
Das kann zweigleisig laufen: Du bekommst automatische Auswertungen (Dashboards/Alarme/Modelle), und wir unterstützen beim Setup und bei der Interpretation – je nachdem, ob du eher Self-Service willst oder Unterstützung im Projekt.
Wie wird das KI-Modell trainiert und Wie lange dauert die Lernphase?
Typisch: Ziel definieren → Daten sammeln → Features/Modelle testen → validieren → in Betrieb nehmen. Die Dauer reicht von einigen Wochen (Anomalie/Trend) bis mehrere Monate (Regression/RUL), abhängig davon, wie viele relevante Ereignisse/Stillstände als Lernbasis vorhanden sind.
Wie sieht euer Support aus?
Wir bieten einen Update-Service (verschiedene Laufzeiten möglich, mindestens 2 Jahre inklusive), mit dem das System per Remote-Update aktuell gehalten wird. Auch Fehleranalysen laufen in vielen Fällen sehr gut remote: Für jede Systemkomponente kann ein Remote-Serviceauftrag angefragt werden, um Ursachen zu prüfen und Maßnahmen abzuleiten.

