Den Maschinenzustand zentral überwachen ...
… um zu sehen, welche Maschine steht, obwohl sie produzieren sollte.

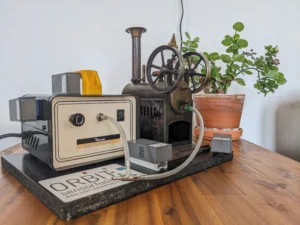
Heterogener Maschinenpark im Blindflug
Ihr Maschinenpark ist seit Jahren gewachsen. Bei älteren Maschinen weiß keiner, ob diese effizient laufen, weil keine Historie über die Betriebszustände vorliegt.
Unsere Sensoren dokumentieren die Betriebszustände Ihrer Anlage.
Maschinenausfall behindert Auftrags-Bearbeitung
Die dringenden Aufträge von gestern hätten längst fertig sein sollen. Stattdessen standen die Maschinen in der Nachtschicht still. Am Morgen weiß niemand was genaues.
Schauen Sie jederzeit nach, warum der Auftrag noch unbearbeitet ist.
Unsere Sensoren dokumentieren die Stillstandszeiten und -gründe Ihrer Anlage.

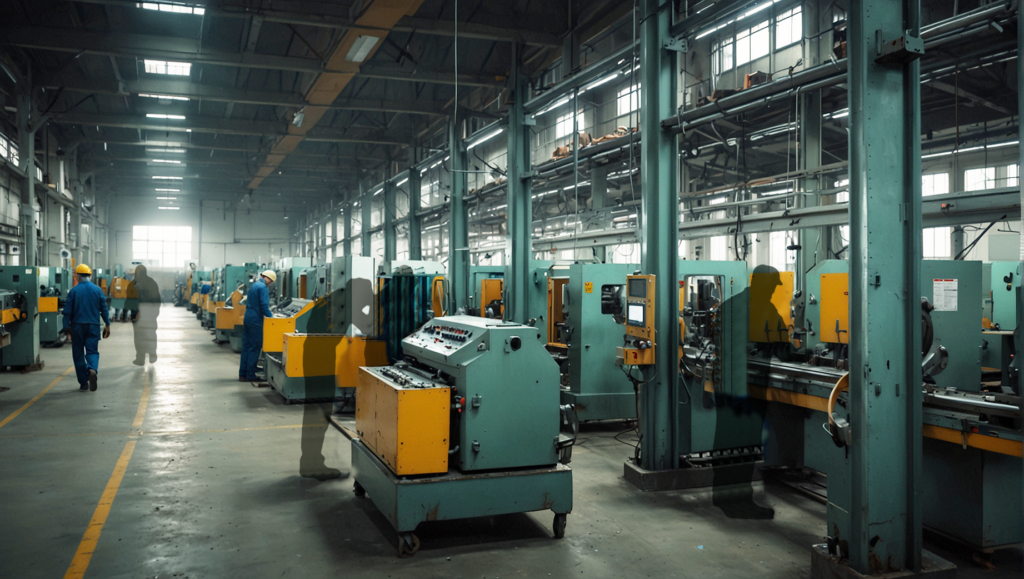
Instandhaltung verteilt Aufgaben ineffizient
Wenn die dringliche E-Mail der Instandhaltungsleitung übersehen wird, dauert es zu lange, bis die alte Maschine repariert wird. Dies führt zu hohen Stillstands-Zeiten und Konfliktpotenzialen.
Unser Dashboard zeigt dem Instandhalter, welche Maschine als nächstes dran ist.
Maschinenzustand zentral überwachen
The Multisensor Cockpit for retrofitting
Betriebszustände erfassen
Stillständen schneller begegnen
FAQ - Frequent General Questions
How quickly do I get the first usable results after installation?
The First data Usually run after ca. 10 minutes one. With simple evaluation techniques (trends, basic checks) can be started immediately after installation. For robust predictive models, additional history is required depending on the target.
What is a sensor node and how many do I need?
As a sensor node, we call our Multi-sensor. Each multi-sensor consists of a printed circuit board with 10 individual sensors: vibration/vibration (acceleration), gyro, magnetic field, temperature, humidity, air pressure, VOC/BVOC, eCO2, IAQ index and light. In addition, further external sensor parameters can be connected (depending on the setup).
As standard, a system with 5 sensor nodes is supplied. For a press motor, many customers start with 1–2 sensor nodes, to collect vibration data on the motor/bearing (plus optional temperature). For the whole press system often come Multiple points at bearing points/gearboxes/drives thereto. (This depends heavily on mechanics, accessibility and the expected error pattern.)
How are the sensor nodes mounted?
There are several mounting options – depending on how "fast" or "industrialized" it should be:
- Very simple and flexible: double-sided adhesive tape or Cable tie
- robust/individual: screw-on mounting plates or customer-specific holder/housing
- depending on the measurement point also possible: Magnetic assembly
Important is always an Fixed, vibrational fidelity Attachment to the desired measuring point.
How often do I need to change batteries?
This depends heavily on the use case – especially on the Sample rate:
- at High frequency vibration (maximum load) the running time is typically at 3–4 days
- at few measurements (e.g. every 15 minutes for 2 minutes) a sensor node can several months running.
If a permanently high measuring load is required, the energy supply can also be ensured via the power grid by wiring.
Can I integrate existing sensors?
In principle, yes. By default, we work with our sensor node ecosystem, but existing sensor technology can be integrated depending on the signal/interface – typically via MQTT or REST, or via the gateway with Bluetooth. If there is no direct standard connection, it is an integration project.
FAQ - Frequent technical questions
Which radio/cable standards do sensor and gateway talk about with which range?
sensor node to gateway runs over Bluetooth Low Energy (BLE). Gateway to cloud typically runs over LTE or WLAN. The range depends on the environmental conditions; In practice, depending on the bandwidth/data load, we typically up to about 10 meters around the gateway.
How many sensor nodes can a gateway serve at the same time?
This depends heavily on the use case or on the data rate:
- at High frequency vibration/oscillation data are typically 2–3 sensor nodes per gateway realistic
- A system is usually from 5 sensor nodes Delivered
- at Environmental data (e.g. temperature/moisture) are also up to about 10 sensor nodes Possible
How is the gateway integrated into our IT?
Standard is the connection by LTE/WLAN into the cloud. If data is to remain local, the gateway can also transfer data to a Customer-side MQTT brokers or in one of the Customer-side database transferred. Typical integrations are MQTT and REST.
How is commissioning done and how much effort is this per machine?
Typical: Mount sensor nodes → Name measurement points in the dashboard → Check data. For pure monitoring, this can be done within A few minutes. Standard data evaluation included. When a complex AI use case is implemented, data/target definition and acceptance are added.
How are system updates made?
Updates are usually carried out via Remote mechanisms (Gateway/Backend) so that the systems remain up to date.
FAQ - Frequent questions about the data
What sampling rates are possible?
For vibration are up to 800 Hz possible (in short also up to 12kHz). Other environmental sensors typically run slower.
What data is stored Where? And how long?
In principle, they shall: Raw data. During processing (e.g. by AI), it can be decided whether Raw data stored or if only Aggregated/processed values (features/results) to the database and displayed in the dashboard.
By default, these data are Cloud on German, GDPR-compliant servers stored. Alternatively, the gateway data can also be Customer-side MQTT or one of Customer-side database supply.
If raw data is written to our internal database, the Memory duration configured will become. Typical guidelines are – depending on the amount of data and customer requirements – with ca. 1 to 12 months.
Who does the data evaluation?
This can run on two tracks: you get Automatic evaluations (dashboards/alarms/models), and We support during setup and interpretation – depending on whether you prefer self-service or support in the project.
How is the AI model trained and how long does the learning phase last?
Typical: Define goal → collect data → test features/models → validate → put into operation. The duration of A few weeks (Anomalie/Trend) bis several months (Regression/RUL), abhängig davon, wie viele relevante Ereignisse/Stillstände als Lernbasis vorhanden sind.
Wie sieht euer Support aus?
Wir bieten einen Update-Service (verschiedene Laufzeiten möglich, mindestens 2 Jahre inklusive), mit dem das System per Remote-Update aktuell gehalten wird. Auch Fehleranalysen laufen in vielen Fällen sehr gut remote: Für jede Systemkomponente kann ein Remote-Serviceauftrag angefragt werden, um Ursachen zu prüfen und Maßnahmen abzuleiten.

